Maps which characters interact with which, and how often. The bigger the dot, the more central they are. Useful for spotting characters who should be more present — or who have quietly disappeared.
What it measures
The analyzer scans your manuscript for every character mention (using both proper names and the aliases you've entered in the Lore Book), groups them by scene, and counts every pair of characters that appear in the same scene together. Each character becomes a node; each co-appearance becomes a weighted edge between two nodes; the weight is the number of scenes they share.
From that graph the analyzer computes two derived measures. First, a structural power ranking using a PageRank-style algorithm — the higher a character's score, the more central they are to the web of on-page relationships. This is different from raw appearance count: a character who appears in ten scenes but always with the protagonist scores lower than a character who appears in seven scenes distributed across several different subgroups, because the latter is doing more structural work. Scores are printed to three decimals in the expanded view. Second, cliques — subgroups of three or more characters who consistently appear together, surfaced as chip lists.
Visually, node size scales with total on-page appearances and edge thickness scales with co-appearance frequency. A well-populated novel usually has one or two dominant nodes (the protagonist and the co-lead), a handful of medium nodes forming a core cast, and a scatter of small peripheral nodes for one-scene characters and walk-ons.
Why it's useful
The network view catches two structural problems that pen-and-paper outlining almost always misses. First: a character you thought was important but who only shares scenes with the protagonist a handful of times — the "important sidekick who never shows up" pattern. Second: two characters you think interact but who never actually share a scene on the page — the "off-page romance" or "off-page rivalry" that reads as a plot claim but has no on-page evidence.
Both are worth fixing. The first is usually solved by adding two or three scenes in the middle third where the underused character has agency. The second is usually solved by writing one meaningful scene where the two characters are visibly together — even if the plot doesn't technically require it, the reader's belief in the relationship requires it.
The network also flags disappearances. If a character has a burst of edges in chapters 1–4 and then no edges at all through the middle third, the graph shows that immediately as an isolated island on the periphery. That's often a rewrite artifact — you cut a subplot and forgot the character was in it — and it's much easier to spot at the graph level than by reading. Use this alongside Story scorecard for unresolved threads and Plot holes for entity-continuity errors; the three together give you the full structural picture of your cast.
How to read it
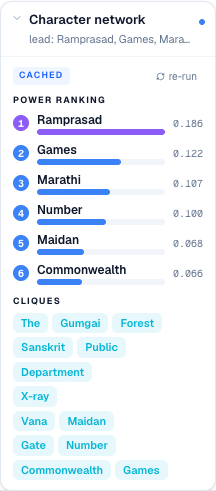
The expanded card renders as a Power ranking list rather than a raw graph — each of the top 6 characters gets a row with a colored rank badge (purple for #1, blue for #2–6), the character's name, a horizontal fill bar showing their PageRank score relative to the top character, and the numeric score printed to three decimals on the right. The bar length and rank position together answer the "who's actually central?" question at a glance.
Below the ranking is a Cliques section that shows any tight subgroups the analyzer detected — small chip lists in cyan, each chip a character in that clique, capped at the top four cliques. If your book has a family cluster, a workplace cluster, and a friend group, they'll usually surface here as three distinct chip groups. A single dominant clique that contains almost every named character usually means everyone shares a scene with everyone; a scattered clique landscape means your subgroups are well-separated.
The collapsed card summary lists the top three characters by PageRank ("lead: Ada, Owen, Joseph"), so you can see the cast hierarchy from the panel without expanding. When you dig into the ranking, the interesting reads are the surprises: a character you expected in the top three who's actually at #5, or a character you thought was minor who's showing up higher than the co-lead. Both are usually worth investigating — either the numbers are telling you something about who's actually driving your book, or they're telling you your intended protagonist isn't getting enough on-page time.
Isolated nodes — characters with only one edge to one other person — usually cluster near the bottom of the ranking and are candidates to either build up (give them another scene with someone new) or cut (fold them into a similar existing character).
When to ignore it
Sparse networks are normal for first-person novels with one narrator and a small cast. If your book is Bridge to Terabithia rather than Game of Thrones, expect a small, uneven graph with the protagonist at the top and one or two other significant nodes — that's fine and doesn't mean the structure is broken.
Novels with a strict single-POV structure where the narrator is alone for large stretches (survival fiction, epistolary novels, prison memoirs) will always have a top-heavy graph because the narrator appears in every scene by definition. The interesting signal there isn't the shape of the whole graph — it's whether the supporting characters are actually connected to each other, which the cliques section will tell you.
Multi-POV novels with alternating chapters can produce misleadingly disconnected graphs when the analyzer can't tie a POV name to the character being narrated. If your book alternates between "Ada" chapters and "Owen" chapters and the network shows them as barely connected even though half the plot is about their relationship, check that both names are set as canonical entries in the Lore Book and that their scenes actually reference each other by name. The graph is only as good as the reference detection, which depends on real name (or alias) mentions in the prose.
Very early drafts before the cast is filled in will produce a lopsided graph dominated by the narrator; wait until you're at chapter-count and have named the significant characters before treating this report as diagnostic.
How to run it
- Click Write in the left sidebar and open the document you want to analyze.
- Open the right-side rail: click the Reports button in the editor's top toolbar (the bar-chart icon).
- In the rail header, click the Reports tab.
- Scroll to the Character network card under the Structural heading.
- Click the card to expand it. First-time runs take 5–20 seconds; a spinner in the header shows while the LLM streams. Cached results render instantly. Re-run inside the expanded card forces a fresh graph.
- The card renders an SVG dot-graph: each character is a colored circle sized by total appearances, connected by lines whose thickness scales with co-appearance frequency. Character names label each node. The collapsed card summary shows the top three by PageRank ("lead: Ada, Owen, Joseph").